Table of Contents
- 1 How are heroes scored and weighted?
- 2 Patch Discussion & Meta Commentary
- 3 Marvel Rivals Hero Rankings (Weighted Scoring) Top 5 - 5/23/25
- 4 Marvel Rivals Hero Weekly Performance Top 5 Winners - 5/23/25
- 5 Marvel Rivals Hero Weekly Performance Top 5 Losers - 5/23/25
- 6 The Hero Ranking (Weighted Scoring) Watchlist
- 7 Marvel Rivals Hero Top 5 Team-Ups - 5/23/25
- 8 Season 2 Meta Trends (Mid-Season Primer)
- 9 Wrap Up
Welcome back to my Marvel Rivals Competitive Meta Analysis series! If you missed the latest report last week, get caught up here.
In this special Mid-Season Primer edition, we’ll skip the usual dive into individual hero rankings, weekly performers, and team-ups and focus instead on the meta trends that have emerged over the season to set you up for success in the Season 2.5 update. This is a fantastic opportunity to look at the underlying data that’s fueled our analysis for the past season and give some data-driven pointers that will help you in your competitive climb. Don’t worry, I’ll still give you all the rankings for our usual categories, and we’ll go back to the deep dive analysis next week.
All of the usual data used for analysis for the week can be found on our meta section of the site.
In this series, I’ll examine and analyze week-over-week shifts in the Rivals Competitive meta across the entire roster, all ranks, and all platforms. I’ll discuss trends and identify opportunities for heroes that may be positioned to outperform relative to the rest of the roster.
Before we jump in, feel free to review how everything works directly below.
How are heroes scored and weighted?
My analysis uses a simple weighted scoring system to evaluate hero performance. Data is centralized and snapshotted from multiple third-party tools. Win rate, pick rate, and ban rate are locked in for each hero at the start of the week, then again after seven days have passed. I then examine the shifts in performance and pass everything through a weighted scoring system.
There were no changes to the weighted scoring system this week.
Hero Rankings Weighted Scoring = (8.5x win rate) + (1x pick rate) - (0.5x ban rate)
The idea is simple. Win rate should be the most significant factor in ranking heroes. Pick rate is evaluated and factored in. How often players are picking certain heroes can be indicative of power or at least preference.
Why is ban rate penalized in the weighted scoring model? Aren’t heroes that are being banned more frequently more likely to be OP?
Ban rate can be a decent proxy for power level—or at least annoyance to play against. Unfortunately, it also works against you when selecting which characters to play and specialize in competitive. There is an opportunity cost to picking, practicing, and playing a character that is likely to get banned. In general, the more you play on a hero, the more you can expect to improve and for those improvements to be represented in your overall win rate with a hero. If you are unable to play your main over a third of competitive games you play, you are potentially hamstringing your performance and practice time with improving and mastering those heroes.
Another thing to note is that ban rate effectively reduces the pick rate of heroes. While a banned hero would not always have been picked for play in a game, the higher the ban rate, the more likely it is that a player who wants to cannot play that character in a match. Therefore, I’ve factored in a penalty for ban rate in my weighted scoring model. The lower the ban rate, the lower the penalty. Ban rate penalty currently represents 5% of a character’s weighted score.
Weekly Performance
There were no adjustments made to the Weekly Performance weighted scoring formula this week.
This weighted scoring system looks at the change or delta (Δ) between the current week's data and the previous week's snapshot. This gives us a good trend of how heroes are progressing and allows us to identify the biggest winners and losers of the week. In this category, heroes who are winning more, being picked more, and being banned less will receive more of a lift. Heroes who are performing worse week over week will be ranked lower in this list.
The scoring system weights for this category must be different from base rankings. Hero win rates remain relatively stable week to week without a balance patch, but pick rates vary drastically as the meta evolves. Using the same weighted system for rankings would result in scores being almost entirely driven by changes to pick rate alone, which paints a severely skewed and flawed glimpse of actual performance.
Weekly Performance Scoring = (20x Δwin rate) + (2x Δpick rate) - (3x Δban rate)
Once Weekly Performance values are created, I run a z-score analysis to determine how many standard deviations (σ) each data point is from the mean of the set to look for statistical outliers and put everything on a comparable scale for analysis. This helps with machine learning and data smoothing/reliability over time.
The Weekly Performance category highlights the biggest winners and losers of the week, and often, the changes and weekly shifts are very subtle, especially as the meta starts to stabilize. But every marginal advantage you can stack in your favor can make a huge difference in your climb, amplified and compounded over the number of games you play. Likewise, every marginal disadvantage you continue to play will adversely affect your results. Here’s a simple graph that illustrates the concept:

The limitations of weighted scoring systems
With the amount of data to gather, compile, calculate, and analyze, it would require substantial effort to segment everything into different Elo brackets for ranked play. To overcome this limitation, I’ll provide callouts in my analysis for certain heroes who are performing well in various competitive rankings. For example, Hela is arguably the best DPS character in the game in Celestial+ lobbies, but is much less frightening in the hands of a Silver player. Less than 8% of the player base is competing in Celestial+ lobbies anyway, so an overall view of the competitive landscape and all its rankings is by default normalized across the entire distribution of the player base.
Improving the model over time
With community and pro feedback, I’ll improve the weighted scoring system over time. It’s likely this is not the optimal form, but it does give a good baseline to compare data over time and early shifts in the Marvel Rivals Season Two Meta. Any additional changes to the weighted scoring system will be called out in future articles in the series.
Note on team-ups: Due to the nature of some third-party data capture tools, some Team-Ups that involve more than two characters are split into individual pairs while others are captured by the full set. This creates some issues with data accuracy, which I’ll work to smooth out in future articles in the series through my own tooling and possible improvements in third-party tools.
Patch Discussion & Meta Commentary
Season 2.5 will introduce countless balance changes, a new hero Ultron, and sweeping changes to team-ups. With so much changing all at once, we’re expecting massive changes to the overall meta and for the status quo to be disrupted. There will be a lot of turmoil over the next few weeks as players adapt and the emerging meta starts to settle, but I’ll be here every week to help guide you through the chaos and search for hidden opportunities to improve your climb.
Powerful Hero Insights to Take Your Game to the Next Level

We’ve massively overhauled the meta section on the site. It’s populated with all of my data analysis tables used to write this series. With Premium, you can help support our content (and enjoy it ad-free) and unlock incredible insights across the entire hero roster and all team-ups. You can filter by metrics and get a full glimpse of the competitive landscape through my weekly reports. Take your rank to the next level and help support our content today!
Marvel Rivals Hero Rankings (Weighted Scoring) Top 5 - 5/23/25
Rocket Raccoon
Iron Man
Mister Fantastic
Storm
Magik
Marvel Rivals Hero Weekly Performance Top 5 Winners - 5/23/25
Adam Warlock
Hela
Namor
Magik
Doctor Strange
Marvel Rivals Hero Weekly Performance Top 5 Losers - 5/23/25
The Thing
Emma Frost
Iron Man
Human Torch
Squirrel Girl
The Hero Ranking (Weighted Scoring) Watchlist
Right now, Groot, Spider-Man, Bruce Banner, Iron Fist, and Human Torch are all being banned in more than 10% of their matches. Heroes on this watch list got significant lift given that ban rates are penalized much less in the updated weighted scoring formula. We will continue to watch these heroes and ensure the weighted scoring algorithm improves over time to accurately reflect power level.
Marvel Rivals Hero Top 5 Team-Ups - 5/23/25
Guardian Revival
Ragnarok Rebirth
Dimensional Shortcut
Gamma Charge (Iron Man)
Gamma Charge (Namor)
Season 2 Meta Trends (Mid-Season Primer)
- Many of the metrics we capture and track are skewed, indicating some lack of balance across the entire roster and Team-Ups (Not a surprise given how many massive changes are being introduced in the midseason balance patch).
- Strong outliers are driving player decisions and standing out from the roster as a whole across each category of performance metrics.
- Team-ups are the strongest thing players can prioritize to quantifiably capture an edge in competitive matches.
- If you’re queuing as part of a group that plays regularly, prioritizing team synergy and consistent use of team-ups can pay off in a big way.
- Prepare to experiment with all the new team-ups and be ready to digest early data.
- Capturing marginal advantages in your competitive play matters over both the short and long term. All players will benefit from this, and players with more time to grind comp stand to gain the most.
- Understand how to build a house edge for your team.
Season 2 Metrics
In this section, I'll take a look at overall metrics for the entire Marvel Rivals roster and team-ups to provide some insight on how things have progressed across the season.
In data analysis, it’s helpful to examine the average(mean) and median values (the middle value of a data set). Average values are sensitive to outliers in the dataset (high pick, win, and ban rates), while Median values can help us get a better representation of the overall dataset and get a sense of what the curve looks like.

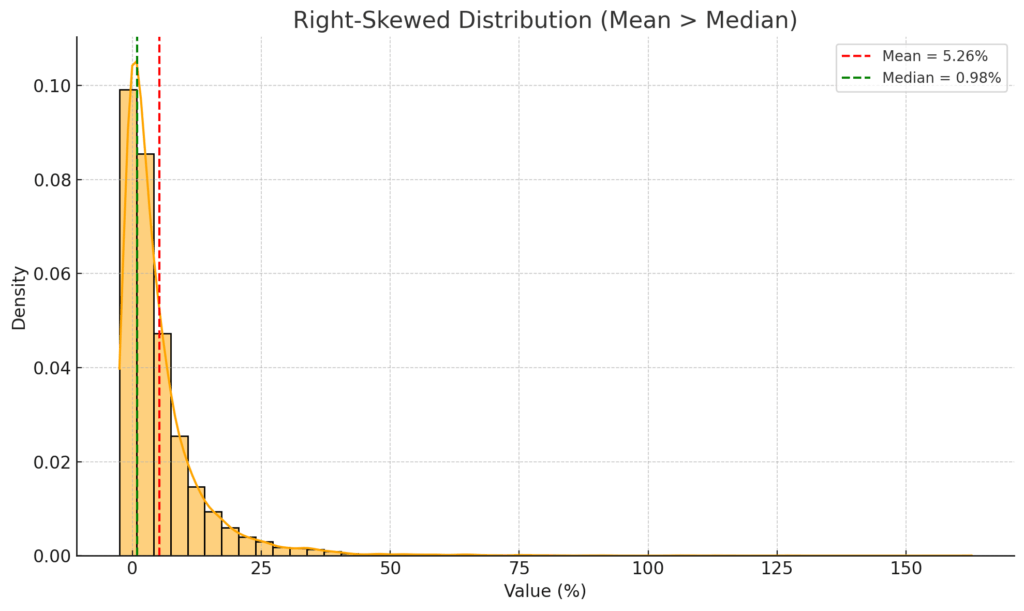
- When the average (mean) is greater than the median, the data is right-skewed(positive), and most values are clustered on the left with some large outliers pulling the average up.
- If the average (mean) is less than the median, then it’s left-skewed(negative), and most of the values are clustered on the right. A few outliers pull the average down.
- When they’re more or less equal, there is a symmetric distribution in the dataset. This can indicate a more balanced state. If Marvel Rivals were perfectly balanced, every metric would have a symmetrical distribution of curve.
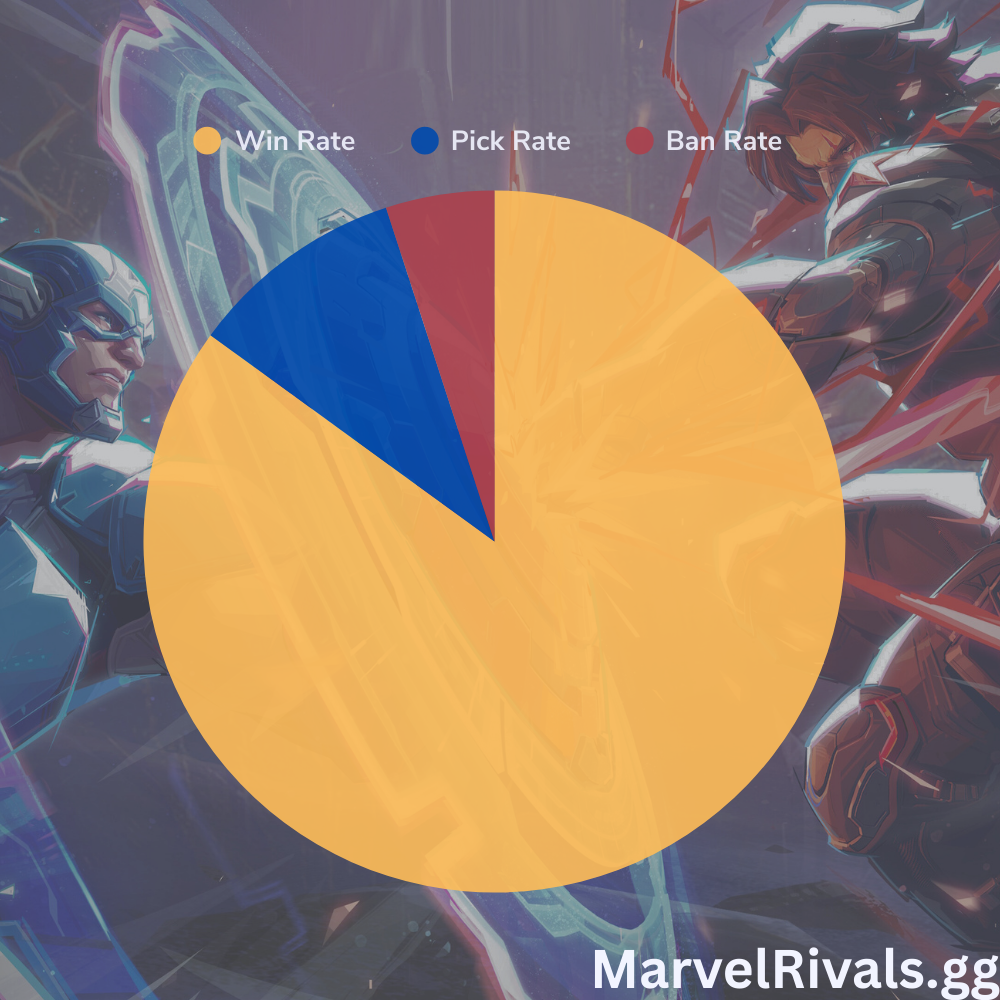
Marvel Rivals Season 2 Roster Metrics
Average Win Rate on the Roster: 48.84%
Average Pick Rate on the Roster: 15.79%
Average Ban Rate on the Roster: 5.26%
Median Win Rate on the Roster: 48.59%
Median Pick Rate on the Roster: 12.76%
Median Ban Rate on the Roster: 0.98%
Win rates are close to symmetrical when examining the average and median values of the dataset. High win rate characters like Bruce Banner, Rocket Raccoon and Storm offset statistical outliers on the other side like Black Widow and Jeff the Land Shark.

With the average pick rate of 15.79% exceeding the median value of 12.76%, the data is right-skewed (positive). Pick rates are being concentrated on the left, with a few strong outliers pulling the average up. Heroes like Cloak & Dagger[item, Rocket Raccoon, Emma Frost, and Invisible Woman with ultra-high pick rates are driving up the skew compared to the bottom of the roster. Of the top five heroes with the highest pick rate, four of them are Strategists. It will be interesting to see if Ultron disrupts this status quo in the strategist meta.

The average ban rate of 5.26% far exceeds the median ban rate of 0.98%, creating a strong right-skew on ban rates. Most values are concentrated to the left of the distribution curve, and a few strong outliers are driving bans. With nerfs coming to Groot,Human Torch, Iron Fist and even more changes to team-ups that have been driving up ban rates for certain heroes, I expect huge changes to overall ban structure and priorities in season 2.5 as the meta is tossed up.
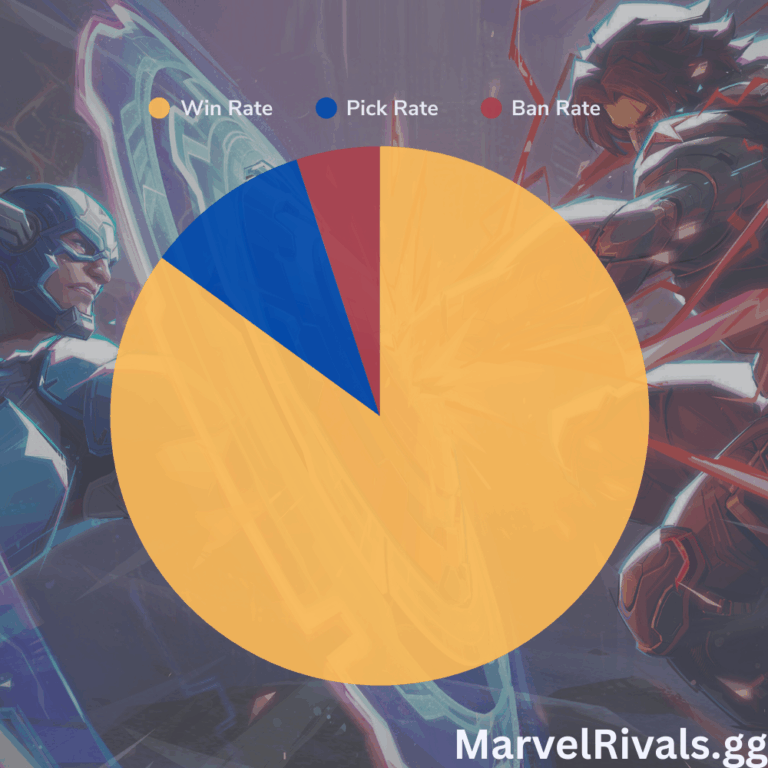
Marvel Rivals Season Two Team-Up Metrics
Average Team-Up Win Rate: 55.03%
Average Team-Up Pick Rate: 6.92%
Average Team-Up Ban Rate: 15.28%
Median Team-Up Win Rate: 55.16%
Median Team-Up Pick Rate: 5.86%
Median Team-Up Ban Rate: 6.30%
Once again, the average and median win rates for team-ups are very close to symmetrical. There is a slight left-skew this time, but it should be considered symmetrical given how difficult it is to balance a game with so many heroes and variables. This indicates good statistical balance across all the team-ups in the game, though there are clearly some outliers on both sides of the curve, as we’ve seen in the weekly meta analysis updates this season so far. With very few exceptions throughout the season, every team-up in the game has produced a higher win rate than the blended win rate for the individual heroes who are part of it. More on this below.

For team-up pick rate, the distribution has a left skew. Most team-up pick rates are extremely low compared to the average, but a few are picked much higher and skew the results. Heading into the Midseason update, Gamma Charge (Namor) was the highest-picked team-up at 13.98% of matches.

Team-up ban rate is where things get interesting. This data set doesn’t have a traditional skew, but has clusters around high and low values. It’s referred to as multimodal in data analysis and shows that team-ups generally fall into two categories: underbanned and overbanned.

The Importance of Understanding Blended Win Rate
The win rates we calculate and show are what we define as the blended win rate - win rates that include both games with and without team-ups for individual heroes. The delta (Δ) (change of values) between team-up win rates and blended win rates gives a snapshot of how much power is gained when picking the team up. The data will always be somewhat obscure due to team-up wins being included in the blended win rate, but you can usually assume that team-ups are lifting overall win rates and sit higher than the blended win rate. This assumption has been true for all team-ups in the game each week of the season so far with the exception of the pre-buff Stars Aligned Team-Up after Winter Soldier’s nerfs.
Roster VS Team-Up Metrics Comparison

Team-ups provide more coordination and raw power in competitive compositions and enable new strategies. They also win substantially more often and are the number one most quantifiable lever you can pull to win more games.
Compared to the average overall roster blended win rate, the average team-up win rate improves your chance of winning a match by a staggering 12.67%.
And remember, since blended win rates already include team-up wins, the actual figure is higher than this when comparing win rates.
Comparing the median win rates shows an almost identical result. In a competitive game like Marvel Rivals, even a 1-2% marginal edge is impactful over large sample sizes. The fact that multiple Team-Ups are sitting at 60%+ win rates heading into the midseason shows that teams that can consistently prioritize team-ups when building their composition can generate strong synergies that can outperform disorganized teams.
Team rate pick is low but targeted. Pick rate will naturally be lower for team-ups since they require two or more heroes to be considered ‘picked’. Despite lower pick rates, the difference in win rate shows that team-ups are high impact when executed.
Team-up ban rate is extremely high, nearly 3x the average ban rate of an individual character on the roster. Players recognize the threat of strong combos and the limitations of attempting to counterplay them in a match. Oftentimes, it’s better just to ban it outright when it’s clear no one on your team wants to play the team-up. A great historical example is Bruce Banner, who has seen sky-high ban rates since the earliest days of Rivals. Rather than play against a juiced Iron Man and Namor, players find it easier just to ban Bruce outright than attempt to counterplay the well-rounded synergy. And that’s a smart decision. Before the midseason changes, both of Hulk’s team-ups were enjoying near 60% win rates across all ranks in competitive!
The Casino Analogy
To emphasize how substantial a 12.67% increased edge is in win rate, consider the casino industry, a multi-billion-dollar vertical.
Casinos drive profits and margin from their floor games in addition to all the auxiliary services and amenities. In general, casinos generate more profit from their games than they do all of their services, like hotels, restaurants, and bars. Games offered on the floor will always have a house edge or some way to capture revenue. Some games have a house edge of less than 2% while others can exceed 15%.
But with any edge, the house always wins in the long run.
Any amount of variance in the short term will be smoothed out and the data will trend toward the statistical average and expected value. And it’s no different in Marvel Rivals. We can’t control our teammates, opponents, map selection, and many other factors that influence the outcome of a match, but we can do our best to build a great team composition and attempt to build a house edge for our team in composition selection and in the heroes we learn and master and bring to the game in competitive.
Prioritizing Team-Ups that skirt by bans in the ban phase is a surefire way to build a house edge for your team. Capture a delta and win more games.
The data we've captured over season 2 is irrefutable.
High win rate, low ban rate team-ups will allow you to consistently get in the reps for winning team-ups without constant bans on your planned synergy. In general, the more games you can play and practice with a single hero/team-up, the better you will perform as you build muscle memory and expertise.
The larger your house edge, the less variance will affect you and the sooner you can overcome a tough pocket of variance that threatens to plummet your rank. Just keep a level head and avoid tilting. Take a break if you’re on a losing streak.
The Importance of Week One in Marvel Rivals Season 2.5
Hero and team-up performance metrics, except ban rate, were mostly consistent across the first six weeks of Season 2.0. The performance in week one was sticky and gave a good indicator of what was to come for performance. I can’t stress the importance of digesting and analyzing week one performance data in attempting to understand how the rest of the season will shape up. It will be critical to pay close attention to how the new team-ups perform and how characters affected by balance changes adjust between this week and next.
In hero shooters, the three pillars of efficient play are Game Sense, Mechanics, and Positioning. Each of these pillars is enhanced when you can take a data-driven approach. Data reinforces each pillar and gives you the information you need to create an edge and set yourself up for success. But remember, at the end of the day, Marvel Rivals is a game, and the whole point is to have fun! Just because a hero you enjoy playing isn’t meta doesn’t mean you should never play them.

Wrap Up
That’s it for week six! We’ll continue to evaluate the meta and how it is evolving next week, keeping an eye out for top performers and rising synergies in season 2.5. I’ve got quite a few updates to make to my spreadsheets and VLookups to make sure our infrastructure is ready for all the new content and changes!
There is so much insight to be found, and I’m hopeful the data from this week gives you some ideas of how you can capture an edge in your own competitive Marvel Rivals play!
What did you think about the sixth week of meta-analysis and our special midseason Primer update? Have any suggestions for the reporting going forward? Any metrics you’d like to see? Let us know in the comments below!